The data provided in the graphs below are specific to Shelby County and the Juvenile Court of Memphis and Shelby County (JCMSC) for 2021.   Information gathered from the JCMSC is used to create the Relative Rate Index (RRI) Tables below.  According to the Office of Juvenile Justice and Delinquency Prevention (OJJDP), “At its simplest, the RRI is a means of comparing the rates of juvenile justice contact experienced by different groups of youth.”  Please keep in mind that the federal government no longer uses the RRI as its comparision tool.

The RRI is designed as a first step in examining Disproportionate Minority Contact (DMC).  It is used to point to areas that need more intensive examination.  The goal for the RRI Table is for the minority categories to have an RRI of 1. That would mean that minorities experience the juvenile justice system at a rate that is consistent with White juveniles.  A score of over 1 means that the population is overrepresented at a certain point of contact compared to White juveniles, and a score of less than one means that the population is underrepresented at that point of contact compared to White juveniles.

The tables shown below are the RRIs for the JCMSC for 2015 through 2021.  Please note that there are no scores listed for Juvenile Arrests.  This is due to the fact that in Tennessee, juveniles are not “arrested,” but rather, they are “taken into custody.”  Therefore, there is no data used for that category, and juveniles that have been taken into custody OR referred to the Court thought another means (Summons, School, etc.) are placed in the Referrals to Juvenile Court category.

To read the RRI table below, consider this example:  the RRI for Black or African American juveniles in the Referrals category is 4.87 in 2021.  This means that for every one While juvenile that was referred to Juvenile Court, there were over four Black/African American juveniles referred to Juvenile Court.  However, this result does not necessarily indicate racial bias.  The RRI merely points out that disparity exists and additional exploration is needed to determine the sources.

Please note that the federal government no longer uses the RRI.


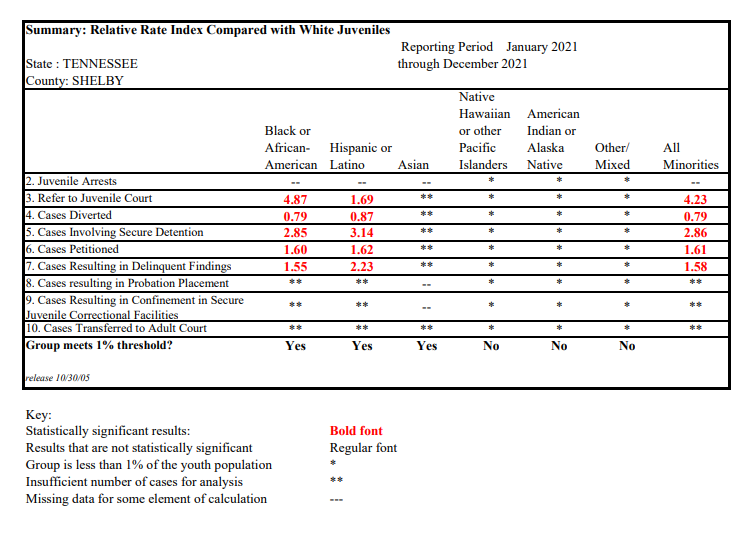
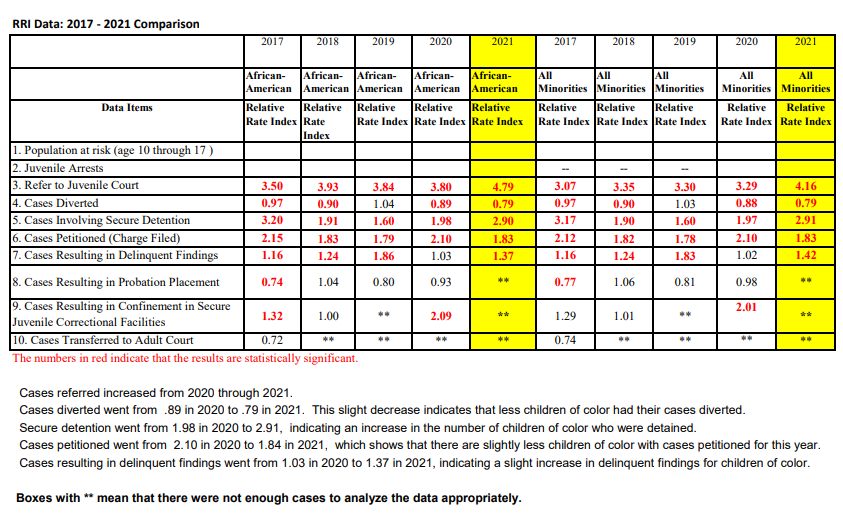
The table below shows a comparison between 2017, 2018, 2019, 2020 and 2021 with some important points noted.

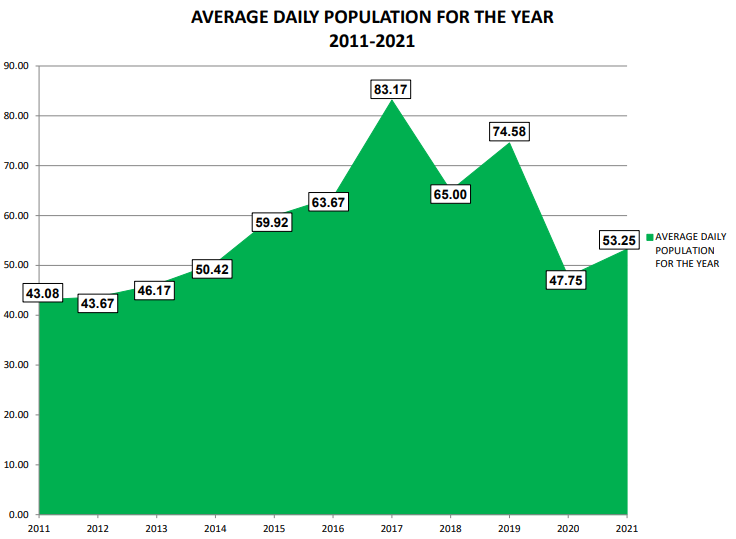
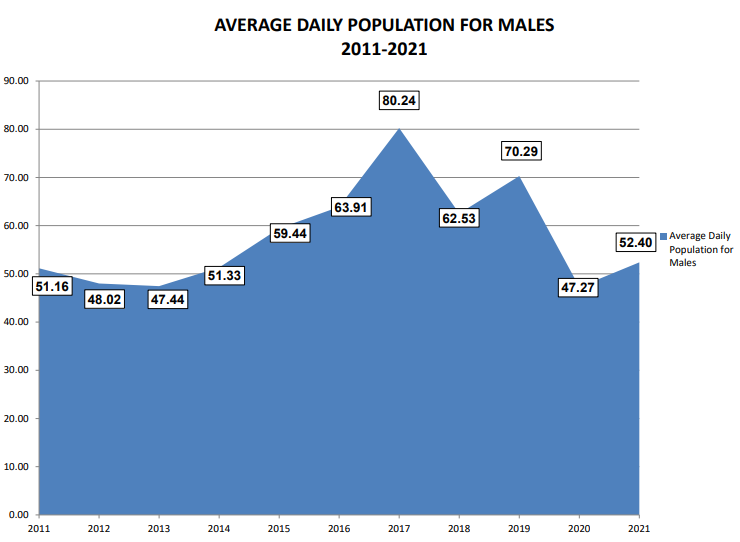
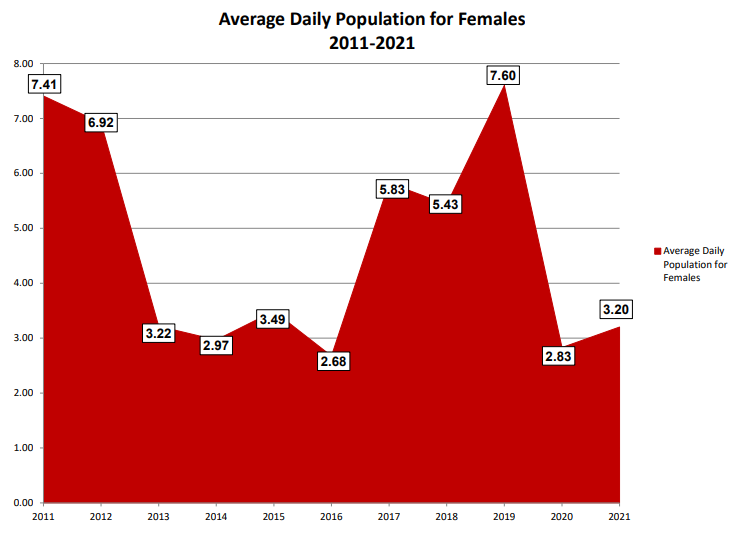
The average daily population statistics below give a yearly breakdown of the number of juveniles, on average, that were held in detention on any given day.  It is further broken down by year for male and female.  

In some cases, due to certain circumstances of the juvenile or offense, the Court may find it necessary to transfer a juvenile to adult criminal court.  As evidenced in the graph below, since 2011, there has been a 66.9% decrease in transfers.  

JCMSC adheres to the guidelines set up in Rule 24 of the Rules of Juvenile Procedure.  For more information and to see the statute on Rule 24, click here.